The quick answer
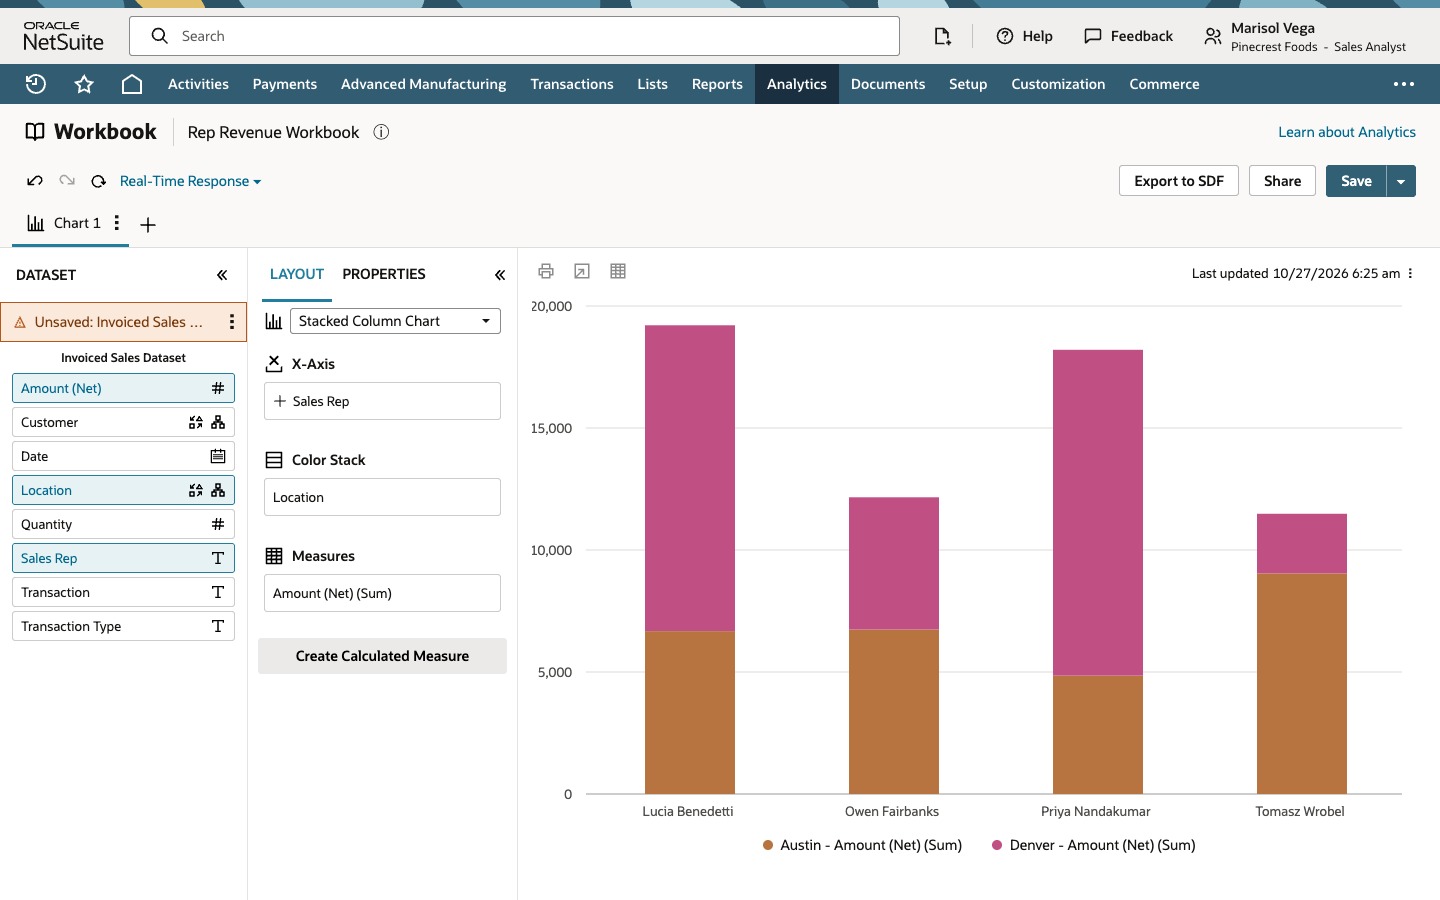
A workbook chart can only use fields that are in its dataset. In the workbook, open the dataset's three-dot menu and click Open Dataset, search for Location and drag it into the result grid, then click Apply to workbook. Location now appears in the workbook's Dataset panel, but the chart does not change yet. Drag Location into Color Stack, keep Show child level only in the Configure hierarchy dialog and click Refresh. In the example, Priya Nandakumar's column of 18,205 splits into Denver 13,355 and Austin 4,850.
The example is a Sales Analyst who wants to see Amount (Net) by sales rep and by location. The screenshots use sample data, and the person, company, customers and amounts are fictional.
Before you start
You need the SuiteAnalytics Workbook feature, access to Analytics and to the workbook, and a role that can view the records and fields in the dataset. Workbook access and dataset access are separate. Record and field permissions decide what you can see, while dataset ownership and sharing decide whether you can edit the original dataset or have to save a copy, so being able to change a workbook's layout does not by itself let you edit or save the dataset behind it. Confirm that the dataset you open is the one that supplies the chart. In the example the dataset has one row per invoice line, and Location is a field under the Sales (Invoiced) record. A Location field that does not change the row grain leaves the row count alone, but that is not guaranteed for every Location field or dataset: a field that brings in a one-to-many join can multiply rows and inflate sums, so compare the row count and a total before and after. Control names can vary by chart type, release and role. This guide calls the area Color Stack because that is its label on the stacked column chart in the example, and other charts or releases may label it differently. The values in the screenshots are sample data, not results you should expect.
01. Open the workbook and read the chart
Open Analytics and click the workbook Rep Revenue Workbook. Chart 1 is a Stacked Column Chart with Sales Rep in X-Axis, Amount (Net) (Sum) in Measures and nothing in Color Stack, so each sales rep has one column. The Dataset panel lists the columns of Invoiced Sales Dataset: Amount (Net), Customer, Date, Quantity, Sales Rep, Transaction and Transaction Type. Location is not there, so the chart cannot use it. Pointing at the column for Priya Nandakumar reads 18,205. Remember that number for the check at the end.
02. Open the dataset and read the banner
In the Dataset panel, open the three-dot menu on Invoiced Sales Dataset and click Open Dataset. The dataset editor opens under the workbook header. A banner reads This dataset is used in 1 other Workbooks. Making a change here will affect these workbooks. The banner means the dataset is reused, not that the other workbook will visibly change. Changes to the dataset's definition, such as fields, criteria, joins and formulas, can affect connected workbooks and their result sets. The toolbar offers Apply to workbook, Cancel, Export and Save, and the grid footer reads Total rows: 12. Note the row count, because adding a field should not change it.
03. Find Location and add it to the dataset
Type Location in Search by name or ID. The results list the matching Records and Fields. The search covers the dataset's record and the records related to it, and a name like Location can match several fields. Use the Location field under the Sales (Invoiced) record, the first entry in the Fields list, and drag it into the result grid. Do not assume that similarly named Location fields have the same row grain. It becomes the last column, with Denver or Austin on every row, and Total rows still reads 12, so in this example the new column did not change the row grain.
04. Apply the change to the workbook
Click Apply to workbook. The workbook returns, and Location is now in the Dataset panel. The dataset's entry in the panel is marked Unsaved, and the chart is unchanged. Apply to workbook applies the edited definition to the open workbook so you can use it. It does not save the dataset, which is why the entry is marked Unsaved. Cancel exits the editor without applying the editor's changes. If changes were already applied, use Discard Changes on the dataset's menu to remove them and return to the last saved definition.
Before you leave the workbook, decide what happens to the unsaved dataset. You can save it, with Save in the editor or Save Changes on the dataset's menu, which updates the saved definition that its other workbooks use. If you own the dataset, that is the step that can change those workbooks, and the visible effect depends on how each one uses the dataset. If you do not own it, you may not be able to edit the original, and you may need to save a copy instead if your role allows it. Or you can discard the changes. A workbook with a visualization based on an unsaved dataset generally cannot be saved until the dataset is saved or the changes are discarded, and if the workbook has several connected datasets, each unsaved one has to be saved or discarded.
05. Put Location in Color Stack and refresh
Drag Location from the Dataset panel into Color Stack. Because Location has a parent-child hierarchy, the Configure hierarchy dialog asks how to display its values. Show child level only shows the child-level values, and Show single-column hierarchy shows the hierarchy in one column with the parent context where it applies. Choose the one that matches your reporting question. The example keeps Show child level only; click Apply. Location now sits in Color Stack and the chart tab shows a warning, but the columns are the same until you click Refresh. The chart changes only when you place the field in the layout and refresh, because adding Location to the dataset only made it available.
After Refresh each column is stacked by Location, and the legend lists Austin and Denver. Pointing at the Denver segment for Priya Nandakumar reads 13,355, and her Austin segment is 4,850, which is the Austin invoice of 4,850.00 shown in the grid. Together they add up to the 18,205 you read in step 1. That check holds only while the row population, filters, currency, rounding and measure are unchanged, the new field added no row-multiplying join, and no rows have a blank or excluded Location.
Common questions
How do I add a field to the dataset behind a workbook in NetSuite?
In the workbook, open the three-dot menu on the dataset in the Dataset panel and click Open Dataset. Search for the field, drag it into the result grid, and click Apply to workbook. The field then appears in the workbook's Dataset panel. Then save the dataset, save a copy if you cannot or should not change the original, or discard the changes.
What is the difference between Apply to workbook and Save?
Apply to workbook applies the edited dataset to the open workbook and does not save the dataset, so the workbook marks it as Unsaved. Save persists the dataset definition. If you own a shared dataset, saving it can change every workbook that uses it. If you do not own it, you may not be able to edit the original and may need to save a copy.
What does the message that a dataset is used in other workbooks mean?
It means the dataset is reused by at least one other workbook. Changes to its definition, such as fields, criteria, joins and formulas, can affect those workbooks and their result sets. It does not mean the other workbook will visibly change, and Apply to workbook alone does not change the saved dataset.
Why does my dataset show as Unsaved in the workbook?
The workbook is using dataset changes that have not been saved. Save the dataset, save a copy, or use Discard Changes to return to the last saved definition. A workbook with a visualization based on an unsaved dataset generally cannot be saved until you do one of these.
Why did my chart not change after I added Location to the dataset?
Adding a field to the dataset only makes it available in the Dataset panel. Drag Location into the chart layout, here Color Stack, and click Refresh to run the query again. A chart can also look unchanged if the field has one value, blank values or values excluded by a filter.