The quick answer
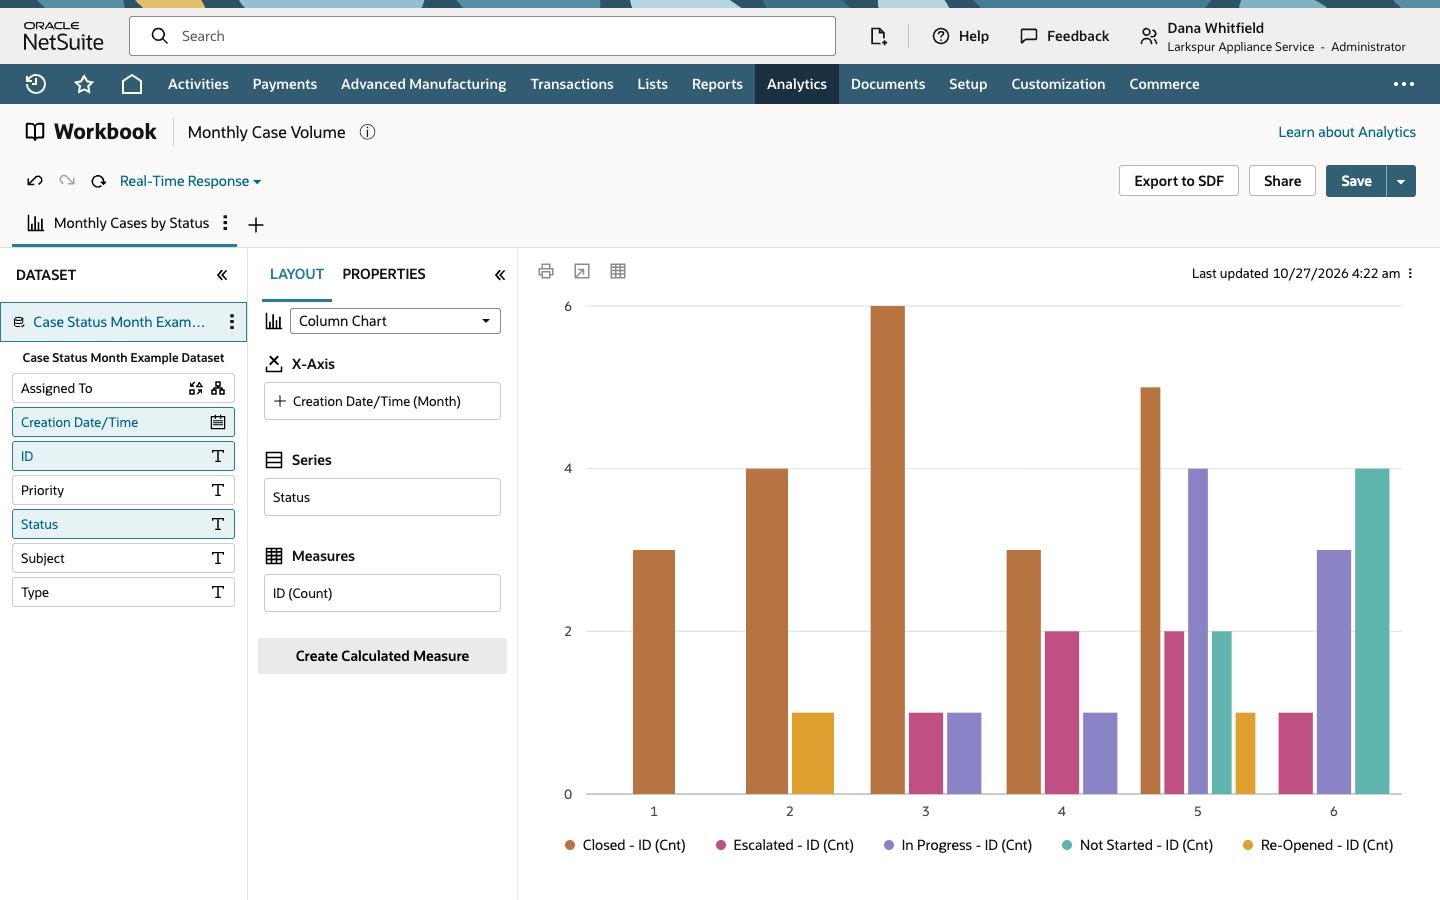
Create a workbook from a Case dataset and choose Chart. Drag Creation Date/Time into X-Axis and set its Date Hierarchy to Month, drag ID into Measures so it becomes ID (Count), and drag Status into Series. Click Refresh after each layout change. The chart then shows how many cases were created in each month, with one column per status inside each month. Each case appears in its creation month under its current status. The chart does not show when cases were closed.
The screenshots show sample data. The company, person, case and status values are fictional. Use your own records and values when following the steps.
Before you start
You need the SuiteAnalytics Workbook feature and a role that can open Analytics and view or build datasets and workbooks. Support case functionality must be enabled and your role needs access to the Case record and the fields you use, because the chart only includes the cases your role is allowed to see. Creating, editing, saving and sharing are separate permissions, so a role that can view a workbook may not be able to edit it. Menu labels, the layout of the Datasets tab, the refresh wording and the way month labels are drawn can differ by release and account.
This example starts from a saved dataset, Case Status Month Example Dataset. It uses the Case record as its root and has the columns Assigned To, Creation Date/Time, ID, Priority, Status, Subject and Type. It has no criteria, so it returns all 44 cases of the example company, every one of them created in the same year. If your dataset has criteria, every chart built from it is limited by them. Before you chart a count, open the dataset and confirm the root record, the criteria and that Total rows matches the number of cases you expect, with one row for each case.
Creation Date/Time is when each case was created, and Status is the case's status now. That decides what the chart can answer: how many cases were opened in each month, and where those cases stand today. It cannot show closures or status changes over time. For a count by closing date, use a closing date field in the dataset if your account has one and fills it in. Cases without a closing date have no date to group on. Status history is a separate source of data and is not part of the Case dataset.
01. Create a workbook from the case dataset
Open Analytics and click the Datasets tab. Click the dataset name, Case Status Month Example Dataset. The dataset editor opens with Case as the root record, the seven columns in the field list, and Total rows: 44 under the results. Click Create New Workbook.
The new workbook asks which visualization type to use for the dataset: Table, Pivot or Chart. The workbook is separate from the dataset. Use Open Dataset from the workbook's dataset panel only when you want to change the dataset itself, because a change there can affect other workbooks built on it.
02. Choose a column chart
Click Chart. The Layout panel opens with Column Chart as the chart type and three drop areas: X-Axis, Series and Measures. A chart needs at least one X-Axis field and one measure, so the Measures area shows a red message, At least one measure is needed, and the chart area stays empty. The tab also carries a warning icon until there is something to draw.
03. Count cases by year, then by month
Drag Creation Date/Time from the dataset panel into X-Axis. A date field starts at the Year level, so it appears as Creation Date/Time (Year). Drag ID into Measures. A text field dropped there becomes a count, ID (Count), which is why you should use a field that is unique for each case. Check the aggregate shown on the item in your release. Nothing is drawn yet. Click the Refresh icon, the circular arrow beside Real-Time Response.
With the year level the chart shows a single column for 2026. Pointing at it reads the count: 44, every case in the dataset.
To break the year into months, open the three-dot menu on the Creation Date/Time (Year) field in X-Axis. Under Date Hierarchy the menu lists Year, Quarter and Month, with Year checked. Choose Month, then click Refresh again. The field now reads Creation Date/Time (Month) and the chart shows one column for each month, labeled 1 to 6 in this example.
Point at each column to read its count: 3, 5, 8, 6, 14 and 8. They add up to the 44 cases from the year view.
04. Split each month by status
Drag Status from the dataset panel into Series. The chart keeps its last picture, and the tab shows a warning icon, until you refresh. The layout changes the chart definition, and Refresh applies it.
Click Refresh. Each month splits into one column per status that occurs in that month, and the legend lists Closed, Escalated, In Progress, Not Started and Re-Opened.
Month 5 is the busiest, with 14 cases. Point at its columns to read the counts: 5 Closed, 4 In Progress, 2 Escalated, 2 Not Started and 1 Re-Opened. These are the cases created in that month, grouped by the status they have now.
05. Name the chart and save the workbook
Double-click the chart tab, type Monthly Cases by Status and press Enter. The tab now carries the new name.
Click Save. In the Save Workbook As dialog, replace the prefilled name with Monthly Case Volume and click Save.
Check the result
- The year view shows one column of 44, the same as Total rows in the dataset editor.
- The month view shows six columns, 3, 5, 8, 6, 14 and 8, and they add up to 44.
- In the split chart, the five columns of month 5 add up to its 14 cases: 5 Closed, 4 In Progress, 2 Escalated, 2 Not Started and 1 Re-Opened.
- A message reads Workbook has been saved., the title reads Monthly Case Volume and the tab reads Monthly Cases by Status.
- If a count looks wrong, check the dataset's criteria, whether a join repeats cases, the role's access to cases, and whether you refreshed after the last change. The numbers above are the results for this example data, not what another account should expect.
Common questions
How do I chart support cases by month and status in a NetSuite workbook?
Create a workbook from a dataset with the Case record as its root and choose Chart. Put Creation Date/Time in X-Axis and set its Date Hierarchy to Month, put ID in Measures so it becomes ID (Count), and put Status in Series. Click Refresh after each change and save the workbook once the totals match your dataset.
Does this chart show when cases were closed?
No. Creation Date/Time is when a case was created, and Status is its current status. A case appears in the month it was created, under the status it has now. The chart does not show closures or a case's status history. For a count by closing date, use a closing date field in the dataset, where your account has one and it is filled in. Cases without a closing date have no date to group on.
Why does my chart stay empty or not change after I move a field?
Layout changes are applied when you click Refresh. Until then the tab can show a warning icon and the canvas can show an older picture. The Last updated time above the chart shows when the data was last pulled. If the result still looks old, check whether your dataset is set to a real-time or a cached response, because a cached response can return data from an earlier run.
Why does the chart say at least one measure is needed?
A chart needs at least one measure and, for columns grouped by a category, an X-Axis field. With nothing in Measures it draws no chart. Drag a field into Measures. A text field such as ID becomes a count, ID (Count).
What if my cases span more than one year?
Creation Date/Time starts at the Year level. Month alone can combine the same month of different years into one column, and in this example every case is in one year. Keep the year in the grouping, or limit the dataset or the chart to one year, so that month 5 means one specific May.