The quick answer
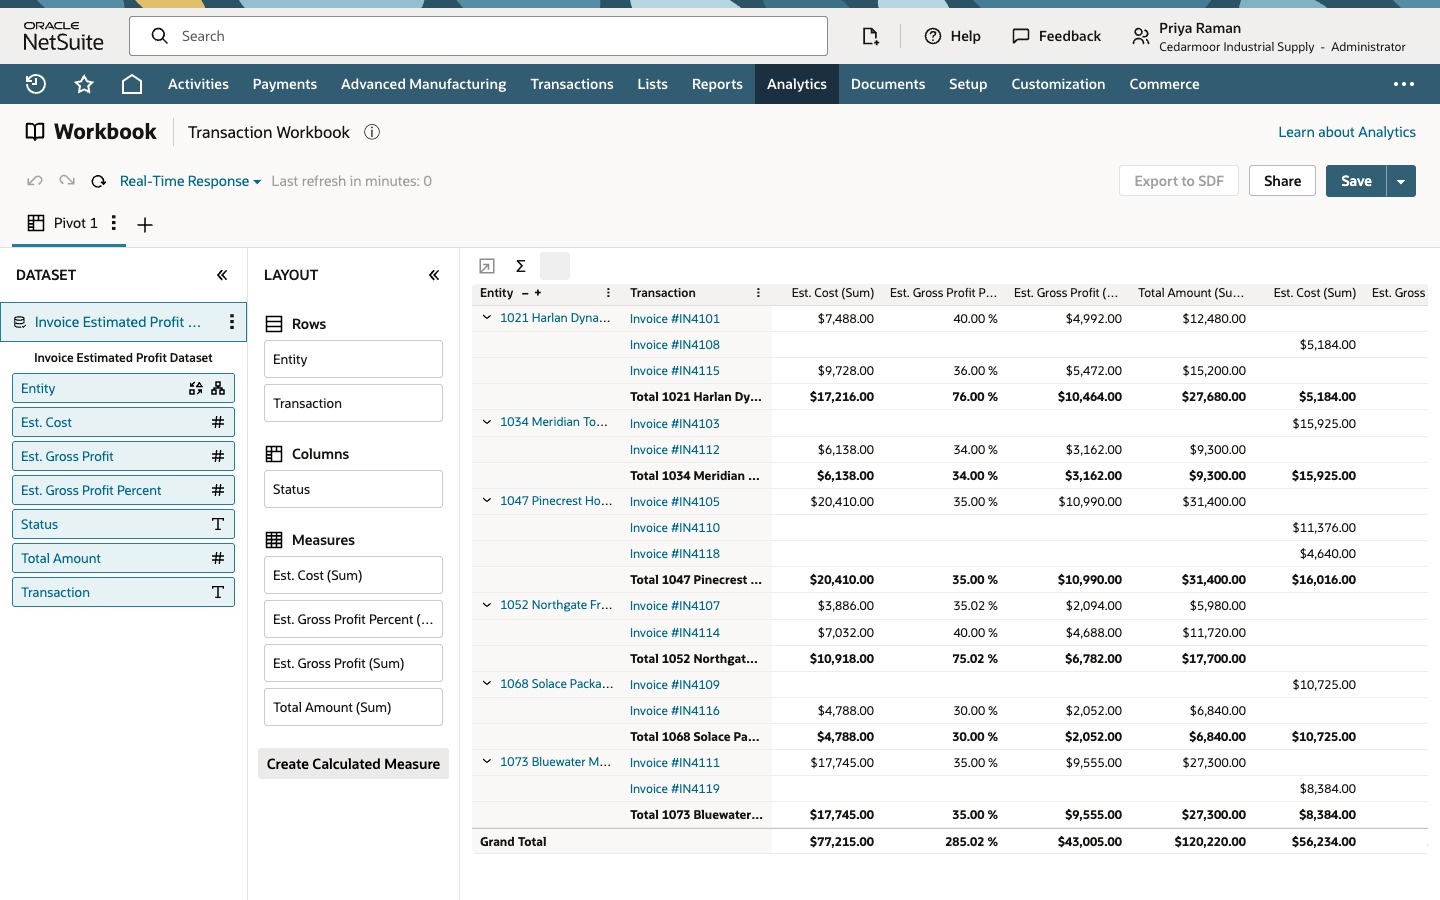
Open the saved invoice dataset in Analytics > Datasets, click Create New Workbook and choose Pivot. Put Est. Cost, Est. Gross Profit Percent, Est. Gross Profit and Total Amount in Measures, in that order, and Status in Columns. Drag Entity into Rows and keep Show child level only in Configure hierarchy. Set Totaling for rows to Bottom, then drag Transaction into Rows under Entity. Every customer becomes a group of invoices with a subtotal row; collapse a group to compare customers, and click a customer name or invoice number to open that record. Use Est. Gross Profit Percent on invoice rows only. On subtotal, collapsed and grand total lines the pivot adds the percentages together, which is not a margin.
The screenshots show sample data. Person, company, customer and invoice values are fictional. Use your own dataset and records when following the steps.
Before you start
You need a saved dataset that returns invoices with the fields Entity, Transaction, Status, Est. Cost, Est. Gross Profit Percent, Est. Gross Profit and Total Amount. The walkthrough uses a dataset named Invoice Estimated Profit Dataset, with Transaction as its root record and 14 invoices. Building the dataset is a separate task. The dataset decides which invoices and fields exist; the pivot only arranges them. Your role needs access to SuiteAnalytics Workbook and to the transactions the dataset reads, and the exact permission names can differ by account.
The estimated fields depend on estimated costing. Est. Cost, Est. Gross Profit and Est. Gross Profit Percent need the Gross Profit feature and items that have a cost estimate, and their values depend on how the cost estimates, lines and any discounts or markups are set up. Some invoices or lines can come back blank. They are estimates, not actual cost of goods sold. Est. Gross Profit is the invoice revenue minus Est. Cost, and Est. Gross Profit Percent is that profit divided by the revenue. In this dataset Est. Gross Profit equals Total Amount minus Est. Cost on every invoice, for example 12,480.00 minus 7,488.00 is 4,992.00 for IN4101. If your dataset does not list these fields, the account or its items are not set up for estimated costing, and the pivot cannot show them. Field names, menu labels, hierarchy options and permissions can vary by account, role, enabled features and release, and some datasets label the amount field with a currency suffix.
This dataset has one row per invoice, which is what makes one Transaction row equal one invoice in the pivot. A transaction-based dataset does not guarantee that. It is limited to invoices, and joins or line-level fields can repeat an invoice and double-count cost, profit and amount. Before you build, open the dataset, confirm its criteria return only invoices, and check a few invoice numbers to see that each appears once. If you want a customer report, also check that Entity holds customers and not vendors or other entity types.
Total Amount is in transaction currency here. If your customers are billed in more than one currency, a subtotal or grand total mixes those currencies and is not a common-currency total, and adding a Currency field does not convert them. Restrict the analysis to one currency or use a base-currency field. The walkthrough has a single currency.
Saving a dataset or workbook does not share it. Share each one with the users who need it. They also need Analytics permissions and access to the underlying transactions. The recording does not save or share the workbook, so use Save when you want to keep yours.
01. Create a pivot workbook from the dataset
Go to Analytics and click the Datasets tab. The list shows each saved dataset with its owner and root record. Click Invoice Estimated Profit Dataset.
The dataset editor lists the invoices behind the dataset, 14 here, with the columns Entity, Transaction, Status, Est. Cost, Est. Gross Profit Percent, Est. Gross Profit and Total Amount. Review them, then click Create New Workbook.
In Choose visualization type for current dataset, click Pivot.
The workbook opens a Pivot 1 tab with a Layout panel that has Rows, Columns and Measures areas.
02. Add the four measures in order
Drag Est. Cost into Measures, then Est. Gross Profit Percent, Est. Gross Profit and Total Amount, in that order. The order in the Measures list is the order of the columns under each status. In the recording each measure shows as a sum, so the list reads Est. Cost (Sum), Est. Gross Profit Percent (Sum), and so on. Check the aggregation shown for each measure in your workbook, and for the percentage in particular.
03. Split the measures by Status
Drag Status into Columns. The pivot repeats the full set of measures under each status value. You get one column group for each status value the dataset returns. Here the invoices have two statuses, so you get Invoice : Open and Invoice : Paid In Full, each with the four measures. Your account can show other statuses or labels. The grid is wider than the panel, so scroll it sideways to see Paid In Full.
With no field in Rows yet, the pivot shows a single totals line. For open invoices it reads $77,215.00 Est. Cost and $120,220.00 Total Amount. For paid-in-full invoices the Total Amount is $87,200.00. The percentage cells on that line, 285.02 % and 217.00 % in this sample, are sums of percentages, which is why they are not margins. See the Read the percentage correctly section below.
04. Add customers as rows
Drag Entity into Rows. Entity has a parent-child hierarchy, so NetSuite opens Configure hierarchy and asks how to show the values. Show child level only lists each customer on its own row. Show single-column hierarchy indents child customers under their parents in one column, and Show multi-column hierarchy gives each level its own column. Leave Show child level only selected and click Apply. The dialog notes that you can change the setting later from the field's item menu in the Layout panel.
Each customer now has one row, with its measures under each status.
05. Place the subtotals at the bottom
Click the Totaling icon, the sigma, in the pivot toolbar.
In the Totaling dialog, the Placement list has a Rows setting with Hide, Top and Bottom. Click Bottom for Rows, then click OK. Totaling controls where subtotal rows sit for the row fields: before the group, after it or not at all. Subtotals always add the measures of their group.
06. Add invoices and collapse a group
Drag Transaction into Rows under Entity. Entity becomes the outer field and Transaction the inner one. With totaling on, every customer is now a group with its invoices beneath it and a subtotal row at the bottom. Here it is a bold row labelled Total 1021 Harlan Dynamics; the label and formatting can vary. The invoices of Harlan Dynamics are IN4101, IN4108 and IN4115. An invoice's measures appear in the column of its own status, so a blank cell under Invoice : Open usually means the invoice is Paid In Full; scroll right to see it. A blank can also come from a null value, so check the invoice row before you rely on it.
Click the arrow beside 1021 Harlan Dynamics. Its invoices fold into one summary line that carries the group's totals, and the other customers stay open. Collapsing changes only the level of detail shown, not the criteria or the rows that are added up. The Grand Total at the bottom stays the same here, $77,215.00 Est. Cost for open invoices. Recheck the totals after you change the layout or add a filter.
07. Open a customer and an invoice
Expand 1021 Harlan Dynamics again. Click the customer name. The customer record for Harlan Dynamics opens. Go back to the workbook, click Invoice #IN4101, and the invoice record opens. Go back again. In the recording both records open in the same browser tab and the browser's Back button returns to the workbook with the layout and the expanded group as they were. Where a record opens can vary with the release and your browser settings, and the row labels only open records you have permission to view. Do not count on Back restoring the layout in your account.
The invoice number opens the invoice. Its Summary total, 12,480.00, matches the Total Amount in the pivot row for IN4101.
A measure cell does not open transactions. A number in the grid is an aggregate, so expand the group to see the invoices behind it, or use the dataset's table view.
Check the result
- Measures lists Est. Cost, Est. Gross Profit Percent, Est. Gross Profit and Total Amount, in that order.
- Columns shows Invoice : Open and Invoice : Paid In Full, each with all four measures.
- Entity in Rows lists six customers on one row each, because Show child level only was selected.
- With Transaction under Entity, each customer has its invoices and a bold Total row at the bottom of the group.
- Collapsing 1021 Harlan Dynamics leaves one summary line, and the Grand Total stays at $77,215.00 Est. Cost and $120,220.00 Total Amount for open invoices and $87,200.00 Total Amount for paid-in-full invoices.
- The customer name opens the customer record, the invoice number opens IN4101 with the same 12,480.00 total, and going back returns the same pivot.
Read the percentage correctly
In this workbook every measure is a sum, including Est. Gross Profit Percent. On an invoice row that is the invoice's own percentage, such as 40.00 % for IN4101. On a subtotal row the pivot adds the invoice percentages. (If your percentage measure used an average instead, you would get an unweighted average, which is also not a margin.) Under Invoice : Open, Harlan Dynamics shows 76.00 %, which is 40.00 % plus 36.00 %. The Grand Total shows 285.02 % for open invoices and 217.00 % for paid-in-full ones, and a collapsed group line shows the same kind of sum. None of these is a margin, and a sum can exceed 100 percent.
The margin for a group is its total Est. Gross Profit divided by the matching total revenue. In this dataset Total Amount is that revenue, so for Harlan Dynamics' open invoices it is $10,464.00 divided by $27,680.00, about 37.8 percent. In your account confirm that Total Amount is the same revenue basis as the estimated profit, because tax, shipping or discounts can make them differ. If you need that figure in the pivot, one option is a calculated measure of total gross profit divided by total amount. The recording does not build one, and the calculated measure screen and formula options can vary by account and release. Until you have one, read the percentage only on invoice rows.
Common questions
Why is Est. Gross Profit Percent over 100 percent on a pivot subtotal or grand total?
In this workbook Est. Gross Profit Percent is summed like every other measure. A subtotal, a collapsed group line and a grand total add the invoice percentages, so two invoices at 40 percent and 36 percent show 76 percent. If the measure used an average instead, you would get an unweighted average, which is not a margin either. Read the percent on invoice rows, or use a calculated measure of total gross profit divided by the matching revenue.
How do I get a weighted gross profit percentage per customer?
Divide the customer's total Est. Gross Profit by its total revenue. In this dataset Total Amount is the revenue, but confirm that for your account before you use it as the denominator. One option is a calculated measure that does that division, so the pivot computes it from the group totals instead of adding percentages. The walkthrough does not build one, so check the calculated measure options in your account and release, and compare the result with a manual calculation for one customer.
What does Configure hierarchy do when I add Entity to Rows?
When you add a field that has a parent-child hierarchy, such as Entity here, NetSuite asks how to show it. Show child level only lists each customer on its own row. Show single-column hierarchy indents child customers under their parents in one column. Show multi-column hierarchy gives each level its own column. This walkthrough uses child level only. The dialog says you can change the choice later from the field's item menu in the Layout panel.
How do I move the subtotals?
Click the Totaling icon in the pivot toolbar. For Rows, choose Hide, Top or Bottom, and click OK. Bottom puts each subtotal row after its group, as in this walkthrough. Subtotals add the measures of their group. Labels and controls can vary by release.
Why are some cells blank under Invoice : Open?
An invoice has one status, so its measures normally appear only in that status's columns. A blank cell under Invoice : Open usually means that invoice is Paid In Full, and its figures sit under Invoice : Paid In Full, so scroll the grid sideways. A blank can also come from a null value or a filter, so check the invoice row.