The quick answer
Open Customization > Performance > Search Performance Analysis and choose Highest Execution Time in the SORTING list. The slowest saved search moves to the first tile. Click it to open Search Performance Details, compare the average with the median, and use the charts to see when the slow runs happened and which context ran them.
The screenshots show sample data, and every figure quoted here is example data that your account will not match. The company, person and saved search names are fictional. The tiles, charts and context names described here were observed in one account and release, so check them against your own role and APM version.
Before you start
You need the Application Performance Management (APM) tools, which put the Performance menu under Customization, and a role that can open them. If the menu or these pages are missing, ask an administrator whether APM is installed and whether your role has access. Nothing on these pages changes the saved search or its schedule.
The time shown is how long NetSuite took to retrieve the search results. It is not the time a page takes to load, so a slow dashboard can have other causes too, such as scripts, workflows, other portlets and the network. The menu, filters, charts and context names can vary with your role, account configuration and release, and a search can be missing because of role access or too little recorded activity. Viewing, sorting, refreshing and hiding a chart series do not edit the saved search.
01. Find the slow search
Go to Customization > Performance > Search Performance Analysis. In the account reviewed, the Saved Searches area opened on Last 24 Hours, sorted by Most Requested, with up to ten tiles, so confirm the window and sort in yours. Each tile in that account showed the search name, script ID and record type, the average and median execution time, the timeout rate, the number of requests and users, and a small trend line.
Most Requested ranks by volume, so a slow search that few people run sits lower down. Open the SORTING list and choose Highest Execution Time, which ranks by the execution time on the tiles, not by the single longest run. Here Open Sales Orders by Region moves to the first tile: a 2.589 second average against a 0.72 second median, a 7.1% timeout rate, 70 requests and 7 users. Every other tile averages under half a second with no timeouts.
To check that this is not a one-day event, open the time window list and choose Last 7 Days. The tile still shows a 2.408 second average and a 3.6% timeout rate, over 443 requests and 11 users. Choose Last 24 Hours again so the details page covers the same period as the first tile.
02. Open the details
Click the Open Sales Orders by Region tile to open Search Performance Details. The Saved Search Details area gives five figures: Number of Users 7, Total Requests 70, Average Execution Time 2.589 s, Median Execution Time 0.72 s and Timeout Rate 7.1 %.
An average more than three times the median points to a few very slow runs pulling the average up, so look at the slow runs rather than the typical one. Open FILTERS to see the start and end date and time and the saved search the page shows; you can change them and apply them with Refresh.
03. Read when the slow runs happen
On the Execution Time chart the median line stays low and the 95th percentile line sits at 19.59 s. The 95th percentile is the time that about 95% of runs finished within, so it is not the longest run and not a share of timeouts. The spikes start around 5:00 PM and climb to that line.
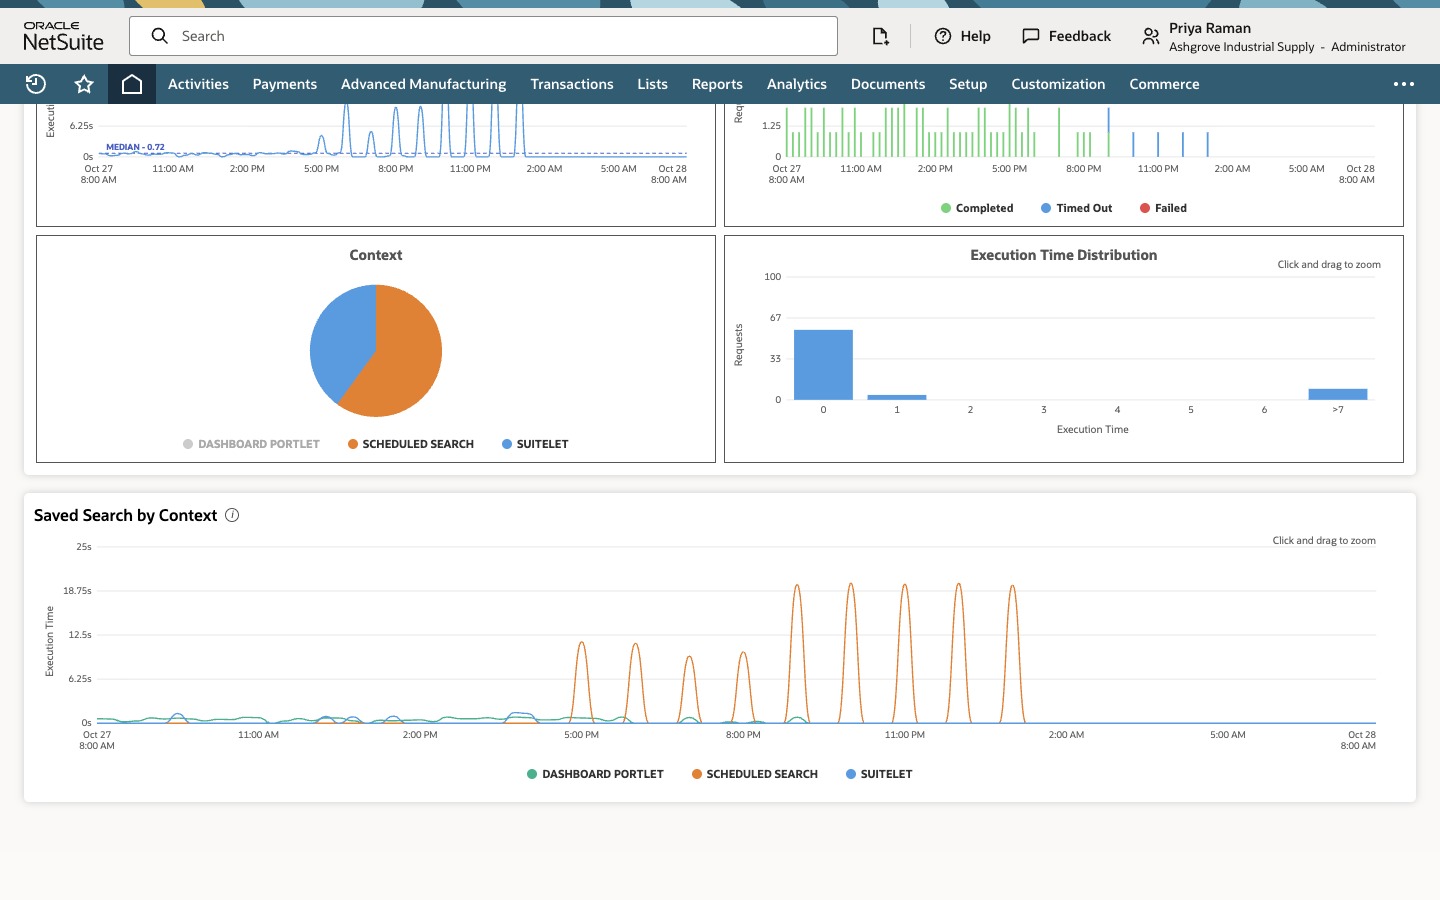
The Requests chart splits requests into Completed, Timed Out and Failed. The five Timed Out requests fall in the same evening hours.
The Execution Time Distribution counts requests by how long they took: 57 ran in under one second and 9 took more than seven seconds.
04. Find the context
The Context chart splits the requests by where they ran: DASHBOARD PORTLET 55, SCHEDULED SEARCH 9 and SUITELET 6. Click DASHBOARD PORTLET in the legend to hide it. Hiding a series only changes what the chart draws. The context names come from your account, so read the labels you see.
In Saved Search by Context the DASHBOARD PORTLET and SUITELET lines stay near zero. The SCHEDULED SEARCH line spikes every hour from 5:00 PM to 1:00 AM. Point at a spike to read its time and execution time.
Check the result
- In this sample, Open Sales Orders by Region is the first tile when sorted by Highest Execution Time, with a 2.589 s average and a 0.72 s median.
- The slow runs and the five timeouts fall in the evening.
- The SCHEDULED SEARCH context carries the spikes, so the next place to look is that schedule and the saved search criteria.
Common questions
Where is Search Performance Analysis in NetSuite?
In the account reviewed, under Customization > Performance. It is part of the Application Performance Management tools, so if you do not see the Performance menu, ask an administrator whether APM is installed and whether your role has access to it.
What do the average, median and timeout rate on a tile mean?
In the account reviewed, each tile showed both. The average is the mean execution time of the runs in the selected window and the median is the middle run, so half the runs were faster. The timeout rate is the percentage of recorded requests that timed out in that window, not a share of page loads. A request count is executions, not rows returned.
Why is the average much higher than the median?
Most runs were fast and a few were very slow. Use the 95th percentile line, the Execution Time Distribution and the context charts to find the slow runs instead of relying on the average.
Does this measure how long a page takes to load?
No. It measures the saved search run. A dashboard can also be slow because of scripts, workflows, other portlets or the network.
What does the 95th percentile line mean?
It is the time that about 95% of runs finished within. About 5% took longer. It is not the maximum and it does not mean 95% of requests timed out.