The quick answer
Give each dataset the same formula fields: a Category that returns a literal such as 'Budget' or 'Actual', and a Signed Amount with the sign convention that lets the two amounts net. Connect the datasets in one workbook, create the Dataset Link on the suggested common keys, then build a pivot with Project in Rows, Category in Columns and Signed Amount in Measures. Show Grand Total on Category nets budget and actual.
The example is a workbook at Fernhill Construction Group. Priya Anand, an administrator, compares a Project Actuals Dataset with a Work Breakdown Structure Dataset that holds each project's budget. The company, names and amounts are fictional example data.
Before you start
You need the SuiteAnalytics Workbook feature and a role with access to Analytics and to the records behind both datasets. Formula fields are saved with the dataset, so every workbook that uses the dataset can see them and a change affects those workbooks. They never change a transaction or a budget record. In the example the Project Actuals Dataset already has two formula fields: Category, which returns the literal Actual, and Signed Amount, which keeps revenue positive and makes cost negative. The budget dataset needs the same two so the datasets can be compared and linked.
01. Open the budget dataset's Formulas group
Go to Analytics, open the Datasets tab and click Work Breakdown Structure Dataset. In the field tree on the left, Formulas is the first group. It is empty for this dataset and offers New Formula.
02. Add the Category formula field
Click New Formula. In the Formula Field dialog name the field Category (up to 50 characters), leave the output type STRING and type the formula 'Budget' with its single quotes. Click Validate, then Save. Every row of the budget dataset now carries the value Budget. Dataset formulas use SQL-style syntax, not saved-search formulas, and a formula field is built from the dataset's source fields rather than from another formula field.
03. Add Signed Amount and save the dataset
Click New Formula again. Name it Signed Amount, choose FLOAT and type a CASE expression. In the Fields tab, choosing a field puts its ID in braces into the formula.
CASE WHEN {account_type} = 'Revenue' THEN -{amount} ELSE {amount} END
Budget revenue becomes negative and budget cost stays positive. In the actuals dataset it is the other way round, so an actual and a budget amount net against each other. Flipping the sign is a reporting choice. Check that both datasets use the same currency, subsidiary and period basis before you add their amounts.
Click Save in the dialog. Both formula fields now appear in the Formulas group with the fx mark and as columns of the dataset. Click Save to save the dataset.
04. Connect the budget dataset to a workbook of actuals
Open Project Actuals Dataset and click Create New Workbook. Click Connect Dataset and choose Work Breakdown Structure Dataset in the Dataset Library. Connecting does not relate the datasets: link them before you use fields of both.
05. Link the datasets
Open the menu beside Work Breakdown Structure Dataset and choose Create Dataset Link. The Dataset Linking page suggests the fields the two datasets share by name and type, formula fields included: Account Type, Category, Project and Signed Amount. A suggestion is only an eligibility check. Keep the keys that identify the same grain in both datasets, remove the ones that do not belong, and click Link Datasets. A dataset link is not a conventional join: SuiteAnalytics combines the two datasets' results on the keys.
Linking at project level is safe only when both datasets are meant to be compared per project. A Transaction dataset has one row per transaction line and a Work Breakdown Structure dataset one row per task, so a link on Project alone can overstate amounts, and summary tasks can be counted with their detail tasks. Prefer a task-level key when both datasets have one.
06. Build the variance pivot
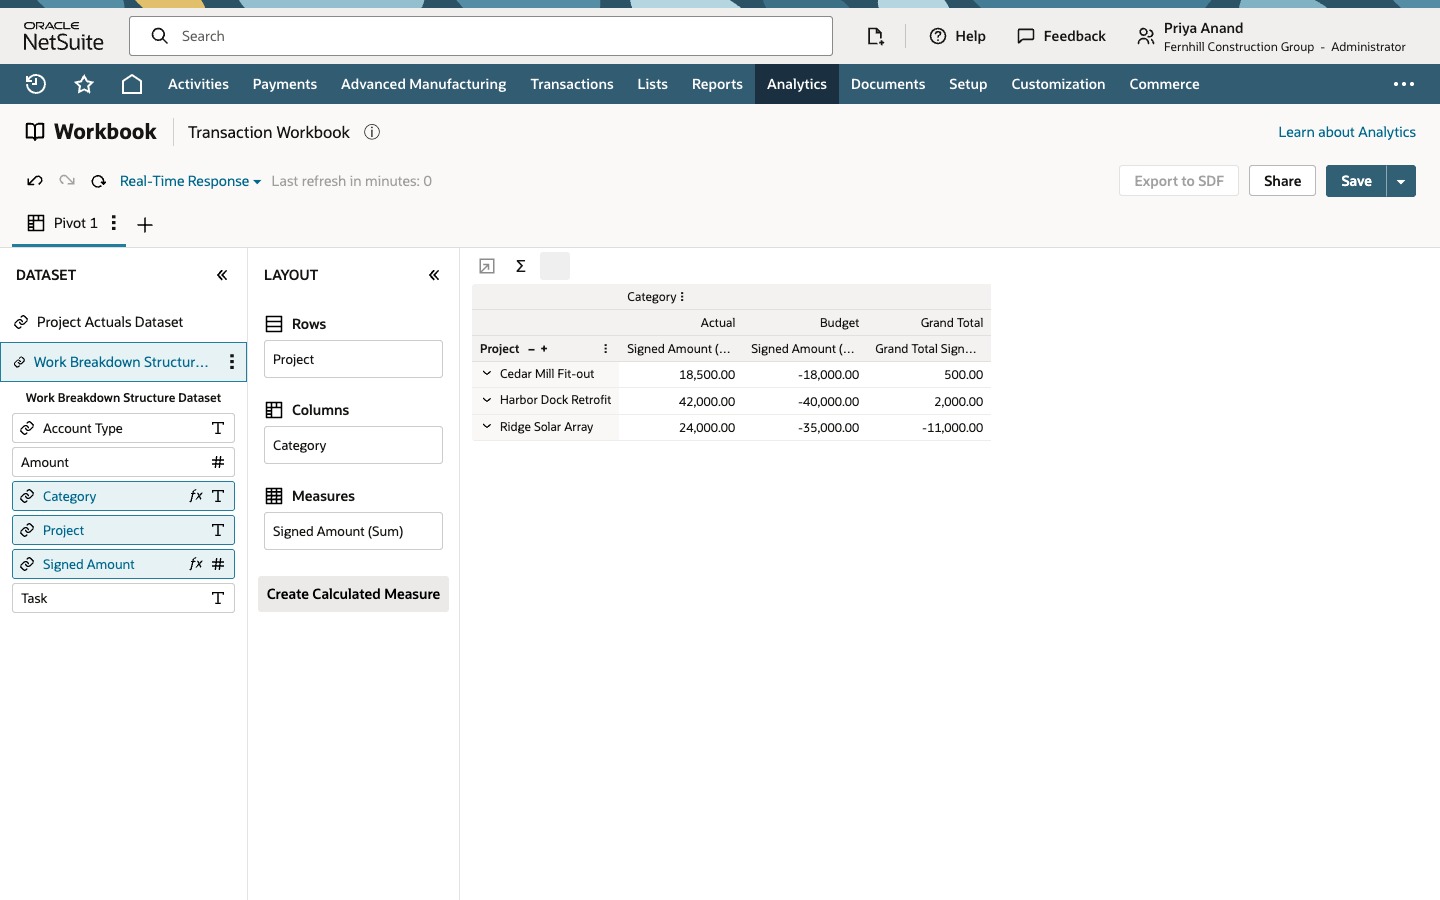
Click Pivot. Drag Project into Rows, Category into Columns and Signed Amount into Measures. A table view is not available for linked datasets, but a pivot and a chart are. Each project has an Actual column and a Budget column.
Open the menu on Category in Columns and choose Show Grand Total. The Grand Total column adds Actual and Budget for each project. With budget stored negative it equals actual minus budget: Harbor Dock Retrofit 2,000.00 and Cedar Mill Fit-out 500.00 are ahead of budget, and Ridge Solar Array -11,000.00 is behind it. NetSuite does not know the total is a variance, so read the sign.
You're done when:
- the budget dataset has Category and Signed Amount formula fields that match the actuals dataset;
- the datasets are linked on the keys that identify the same grain;
- the pivot shows an Actual and a Budget column for each project;
- you have compared a project's total with the datasets before relying on the variance.
Common questions
Does a formula field change my transactions or budget?
No. A formula field is saved with the dataset and computes a value from the dataset's rows. It does not change any record. Every workbook that uses the dataset can use it, and changing it affects those workbooks.
Why add a Category formula field?
The two datasets share no field that says which rows are budget and which are actual. A formula that returns a literal, such as 'Budget' or 'Actual', tags every row, so one pivot column can hold each.
Why do the signs differ between the datasets?
So the amounts can net. Actual revenue is positive and budget revenue is negative, and cost is the other way round, so the Grand Total across Category is actual minus budget. It is a reporting choice, and both datasets must use the same currency, subsidiary and period basis.
Can I link two datasets on a formula field?
Yes. The Dataset Linking page suggests fields that share a name and type, formula fields included. Matching names only make fields eligible, so check that the values mean the same thing in both datasets.
Why do my linked project totals look too high?
A link on a loose key, such as Project alone, can combine many transaction lines with many tasks and overstate amounts, and summary tasks can be counted with their detail tasks. Use a key at the grain you mean and compare a few totals with the datasets.