The quick answer
Open the existing weekly Item Demand Plan in Edit. On Demand, enter your manual amounts in Quantity on the two rows after the last calculated week. Save and reopen the same plan. The two amounts appear under Quantity, with their Weekly Calculated cells blank.
Before you start
You need classic Demand Planning, Advanced Inventory Management, and permission to edit Item Demand Plans. Start from an eligible Time Phased item with an existing weekly forecast. Use the Start Date and End Date filters to show the later weekly buckets if they’re outside the displayed range. The rows must be editable in the plan. This example uses Sunday week starts. Check your account’s First Day of Week preference and read the dates shown on the rows.
This example uses fictional people, company names and records. Alex Morgan at Example Supply Co. plans Inline Strainer at Northfield Warehouse in subsidiary Example Supply US.
01. Find the end of the forecast
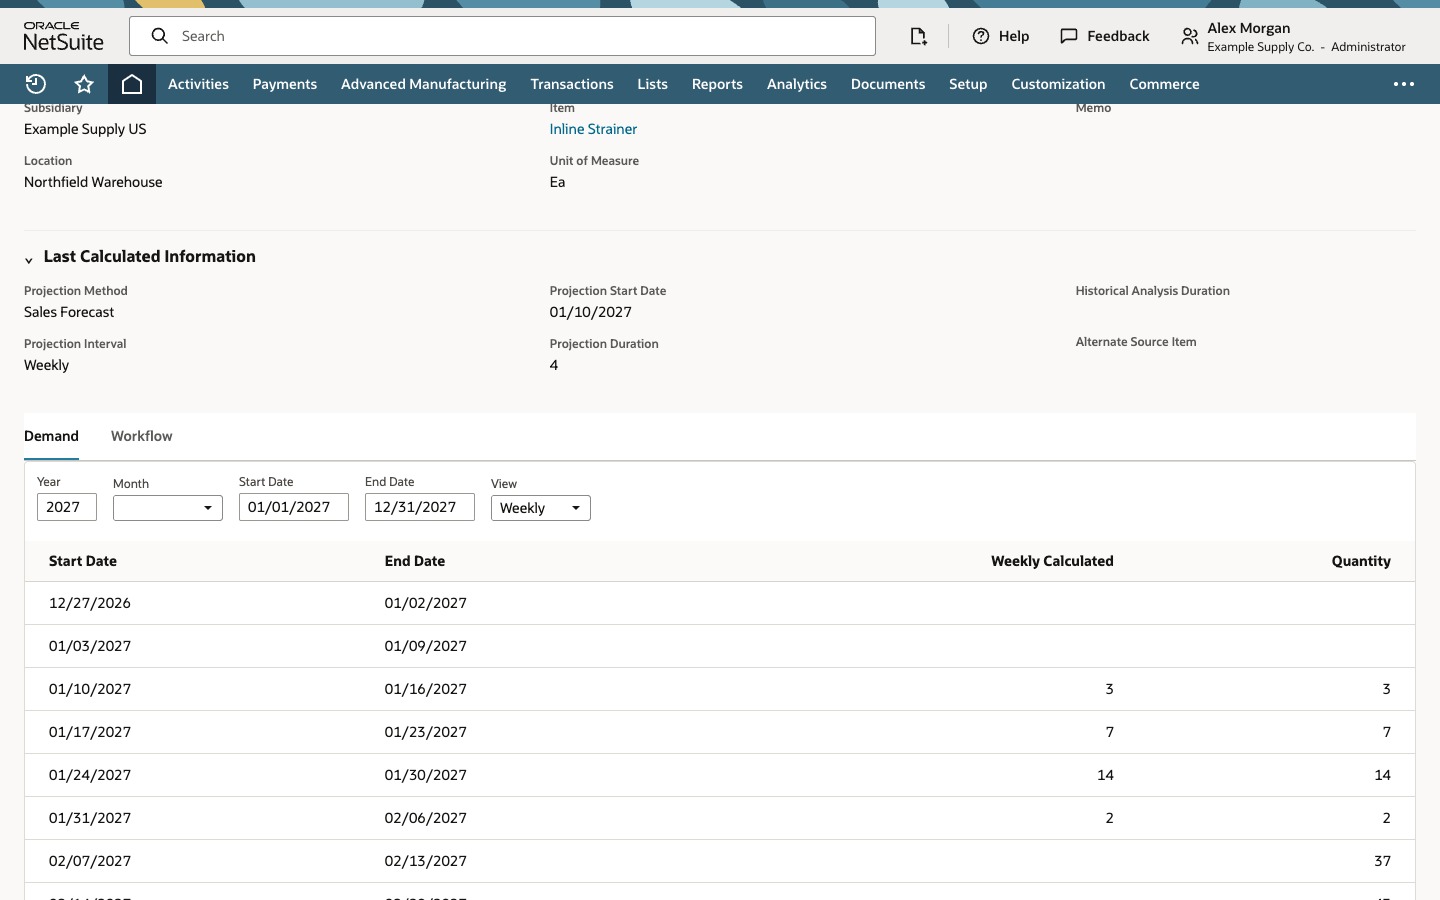
Go to Transactions > Demand Planning > Item Demand Plans. On the Inline Strainer row for Northfield Warehouse, click View. Under Last Calculated Information, find Sales Forecast, Weekly, and Projection Duration of 4. The first calculated week starts 01/10/2027.
The four calculated weeks have Weekly Calculated values of 3, 7, 14 and 2. The next two rows start 02/07/2027 and 02/14/2027, after the last calculated week ends on February 6. Both later rows start blank.
02. Enter the two manual quantities
Click Edit on the same plan. In Demand, enter 37 under Quantity for the week starting 02/07/2027, then 43 for 02/14/2027.
Click Save. In this example, Item Demand Plans opens with a confirmation naming the item and location. Check those names before reopening the record.
03. Reopen the plan and compare both columns
Click View on the same item and location. Projection Duration still reads 4, and the original four calculated values are still 3, 7, 14 and 2. The two later weeks now show 37 and 43 in Quantity, with blank Weekly Calculated cells.
Common questions
Does editing Quantity change Projection Duration?
Projection Duration records the duration of the last calculation. It stays at four weeks after you save the two later quantities. You can verify both the four-week calculation and the manual additions on the reopened plan.
What does a blank Weekly Calculated cell mean?
NetSuite displays no calculated forecast for that period. Read Quantity separately to see the planned demand stored for the week. A displayed zero is a value, while a blank shows no value in that column.
What if the two later rows are missing?
Check the plan’s date filters and the account’s weekly boundaries. The example edits weekly buckets already available in Demand. If the rows fall outside the editable date range, confirm which dates your plan makes available before proceeding.